Better care delivery is better retention.
NutriClient connects clinical outcomes to practice performance. See which clients are engaged, which are at risk, which protocols are working, and where dietary patterns correlate with symptom changes. The data that improves care is the same data that improves retention.
Clients don't leave practices that show them progress.
The most common reason clients stop rebooking is that they don't feel like things are changing. Not because they aren't — but because nobody showed them. Progress tracking closes this gap. When clients can see their own trends, adherence data, and improvement markers, care feels tangible. And tangible care retains.
Clients who can see their tracker trends and milestone achievements are more likely to stay motivated and continue care.
When you can see which clients are declining before they cancel, you can reach out while the relationship is still active.
Knowing which approaches work for which populations means your next care plan starts from better evidence than the last.
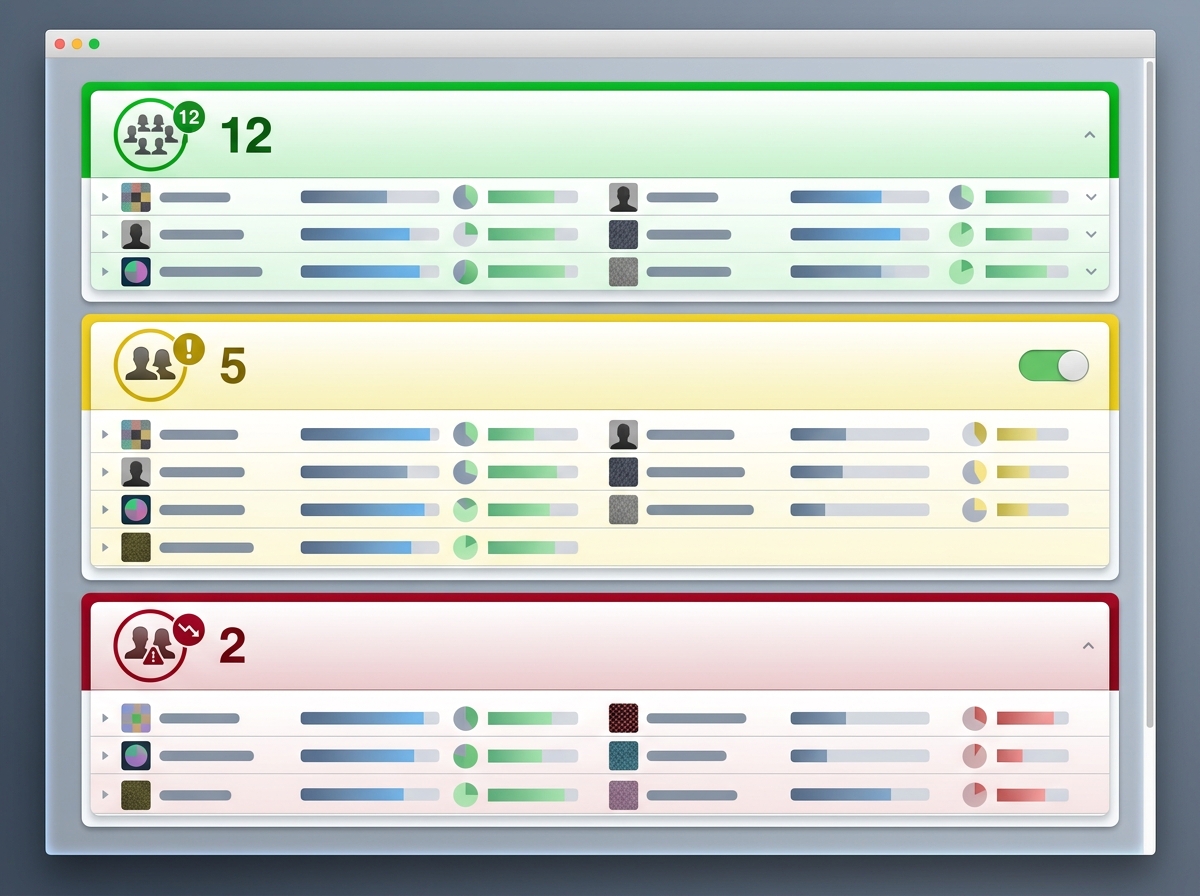
Caseload management
Red. Yellow. Green. Know where to focus.
Your caseload view groups clients into three engagement tiers based on tracker adherence, appointment attendance, and intervention activity. Green clients are on track. Yellow clients need attention. Red clients are at risk of disengaging.
The attention-ranked list puts the most critical clients at the top. One click drills into a client's full progress history. You spend your outreach time on the clients who need it most — not the ones who happen to be next on a flat list.
Nutrition-exclusive
See what your client's food is doing.
The symptom-to-dietary-pattern correlation review lets you select a symptom field and a dietary field from the client's tracker data and see how they relate over time. Compare periods side by side. View grouped summaries with bar charts. Read plain-language pattern findings like “higher fiber intake periods correlate with reduced bloating scores.”
This isn't statistical analysis — it's structured clinical pattern review. It surfaces associations for you to investigate, not causal claims. But when a client asks “is the diet change helping?” — you have data to point to instead of intuition.
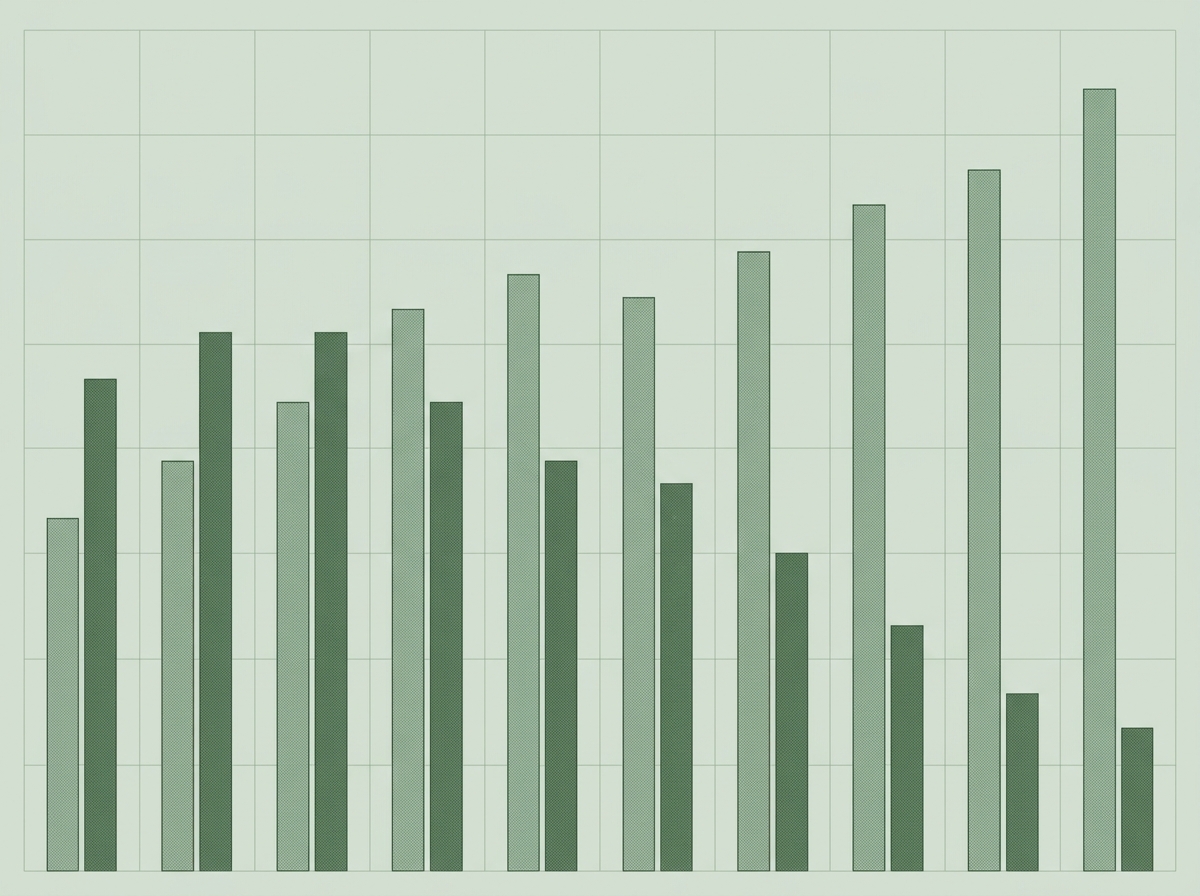
Protocol effectiveness
Which approaches actually work?
Compare outcomes across care plan protocols. See which templates produce the best engagement rates, adherence scores, and progress metrics across your client population. Over time, this data refines your protocol library — so every new care plan starts from stronger evidence than the last.
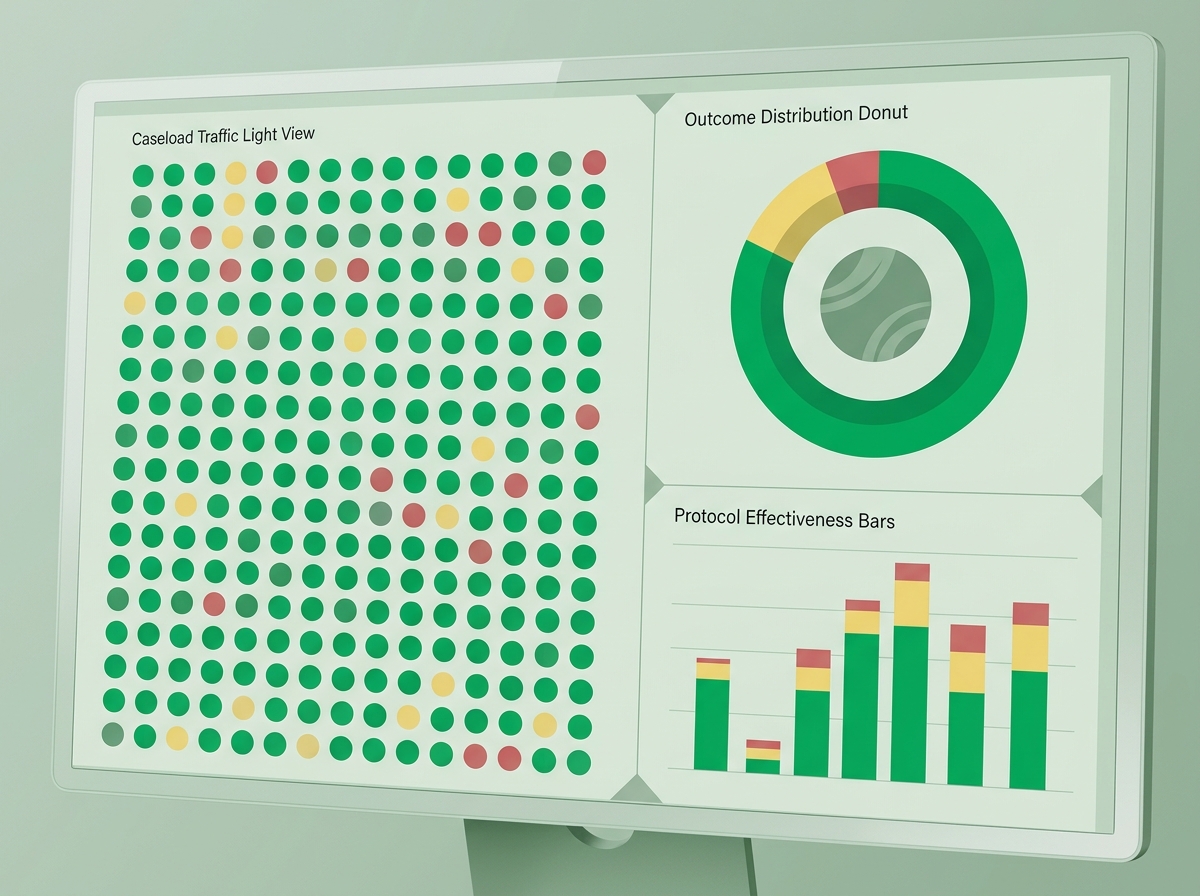
Population outcomes
See the big picture across your practice.
Population outcome distribution shows how your clients are doing as a whole. What percentage are improving? Stable? Declining? The aggregate view reveals practice-level patterns that individual client records can't show — seasonal trends, protocol-wide gaps, and opportunities to improve care delivery at scale.
Frequently asked questions
The practices growing fastest are the ones that can prove their outcomes.
See how NutriClient connects clinical progress to practice performance — caseload intelligence, protocol effectiveness, and the data that turns good care into visible results.